العربية

Products

InsightsGrid

InsightsGrid

Analytics Live

Operational dashboards over your own data: upload it, model it, and read the numbers that decide a shift.

383
source files
28
API routers
23
schema migrations

bi.quneva.com

What it does

  • Signs in through the QuNeva account, with no second password
  • Upload a dataset and model it without writing SQL
  • Dashboards that read correctly in Arabic and in English
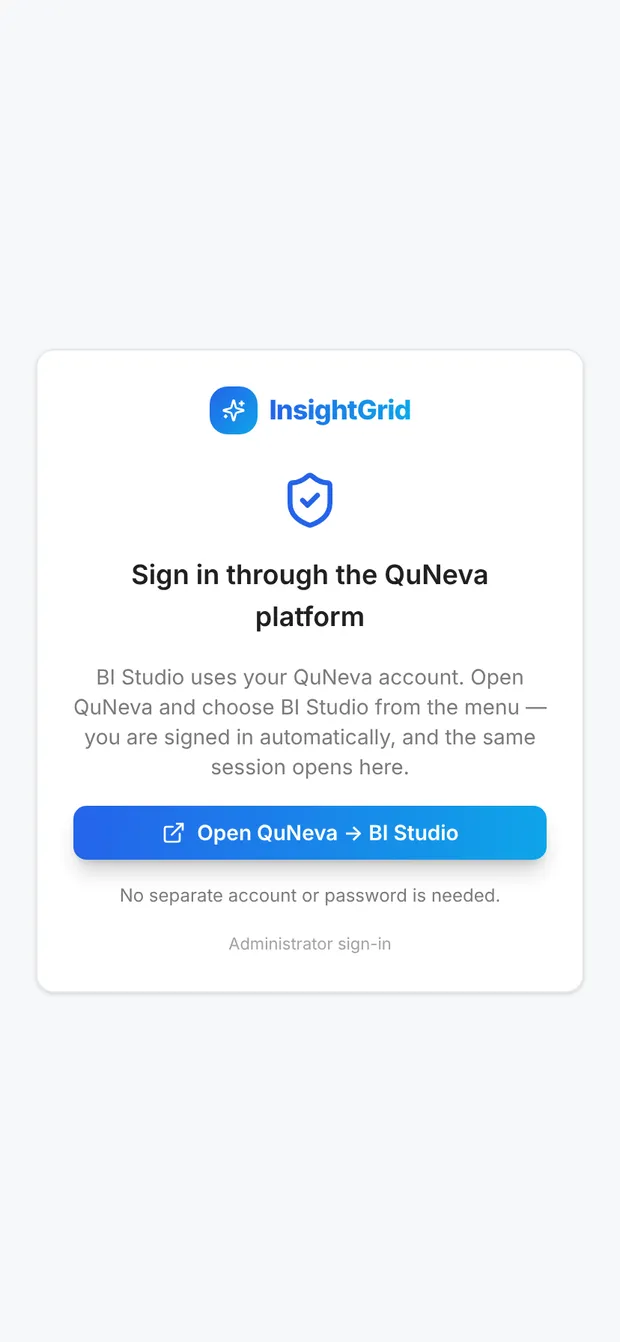
Sign-in, through the QuNeva account
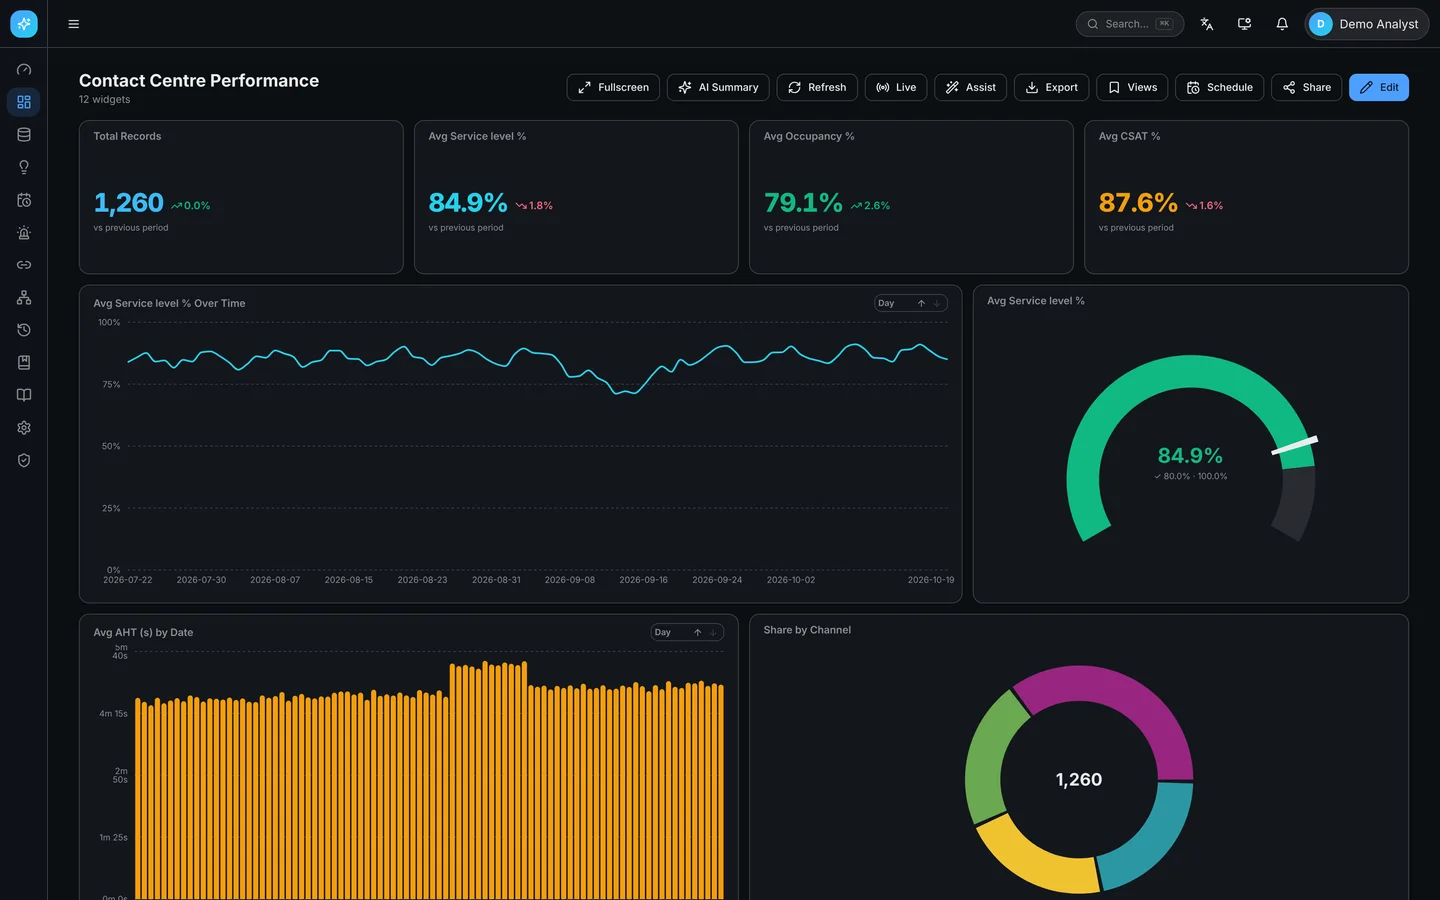
A board the product designed itself from one uploaded file: the KPI strip, the trend, a gauge against target and the share per channel
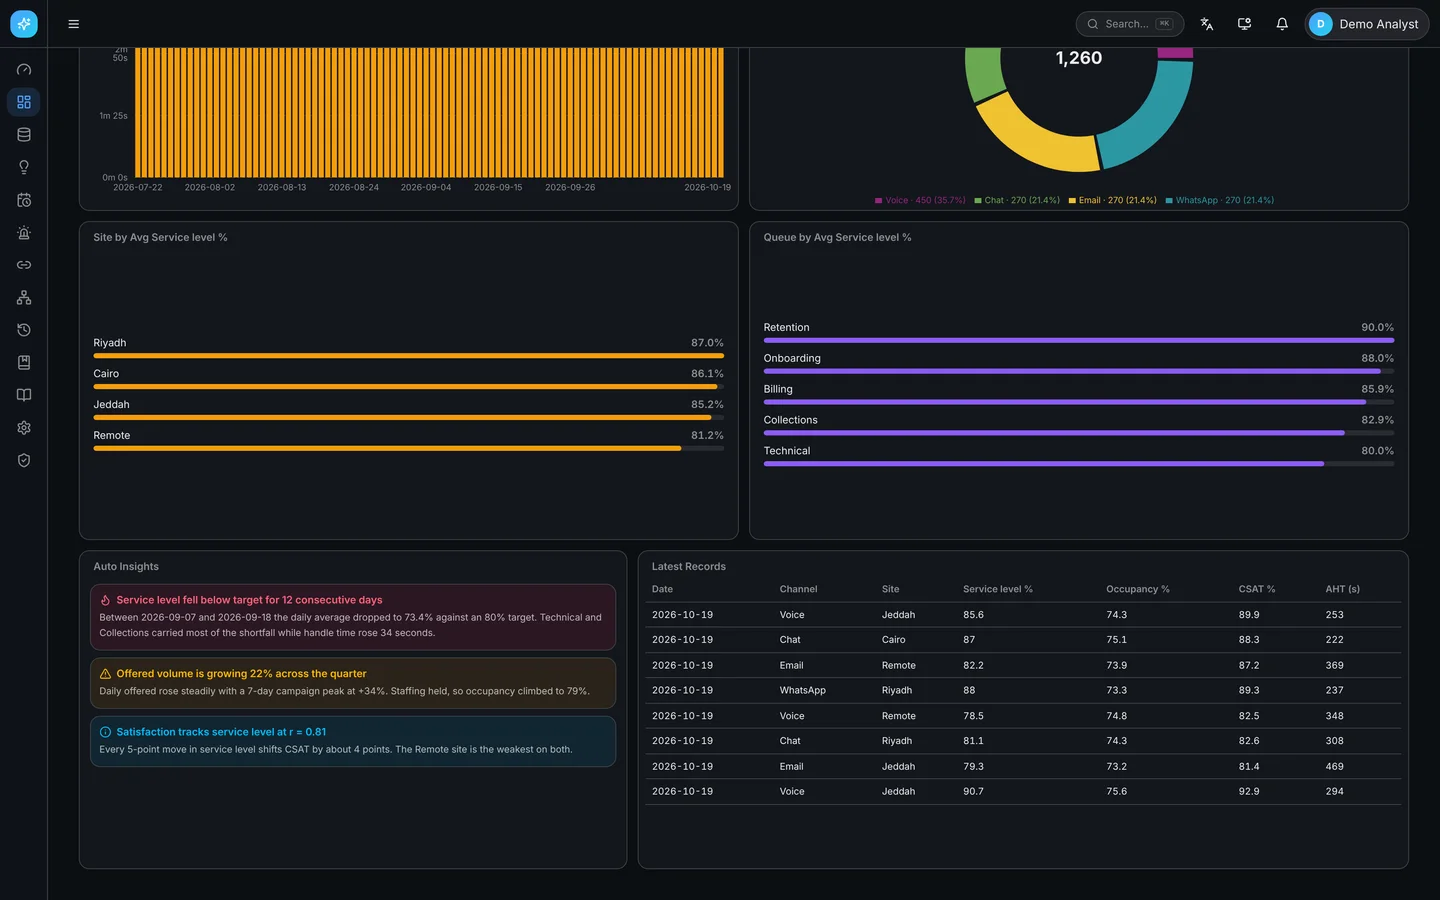
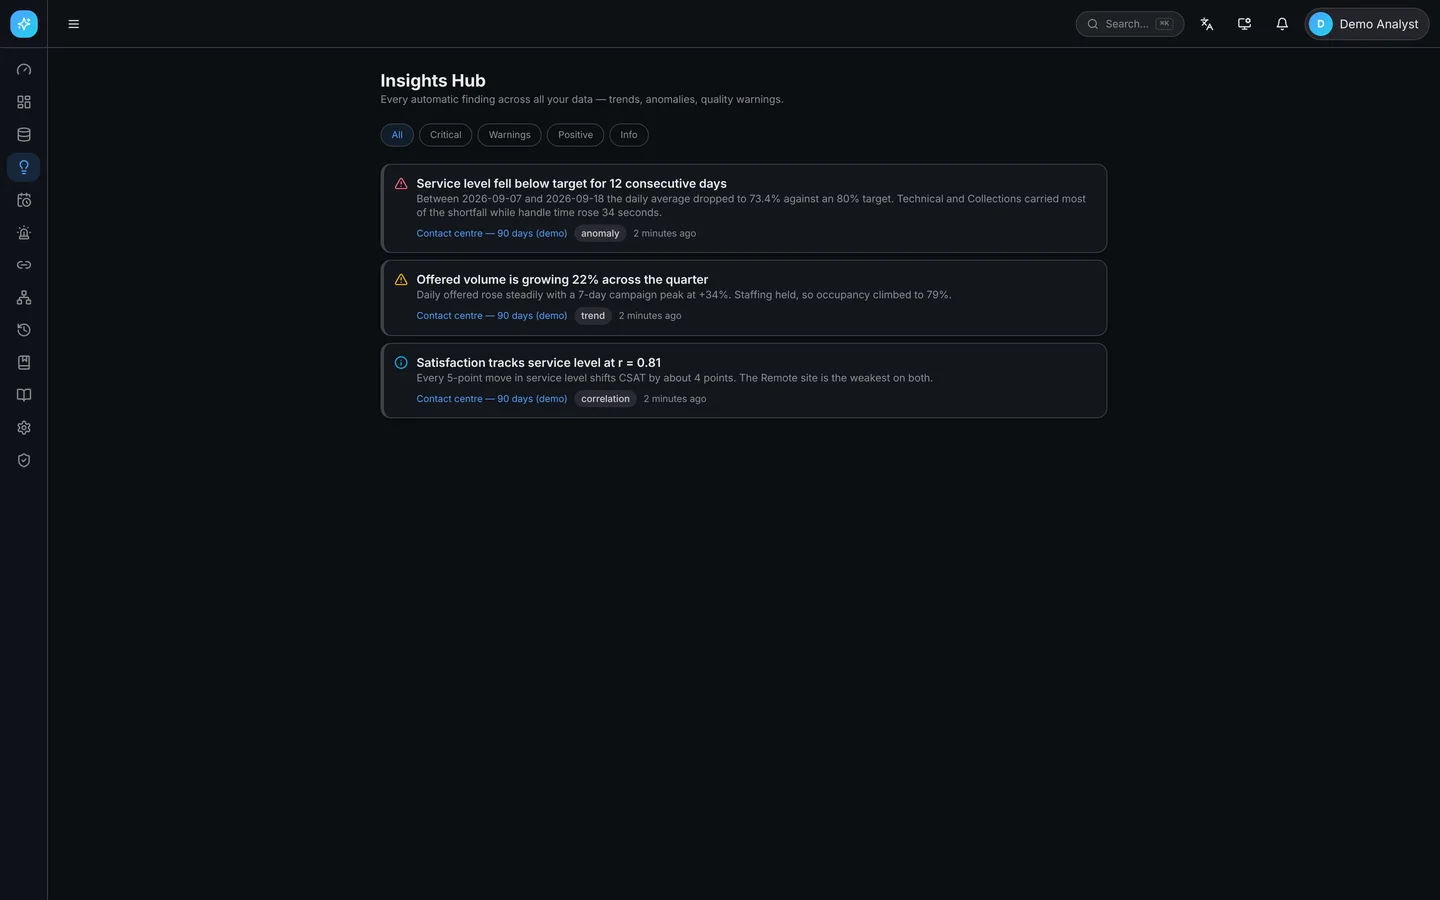
It reads the numbers back: a twelve-day service-level breach, the growth behind it, and the correlation that explains the satisfaction score
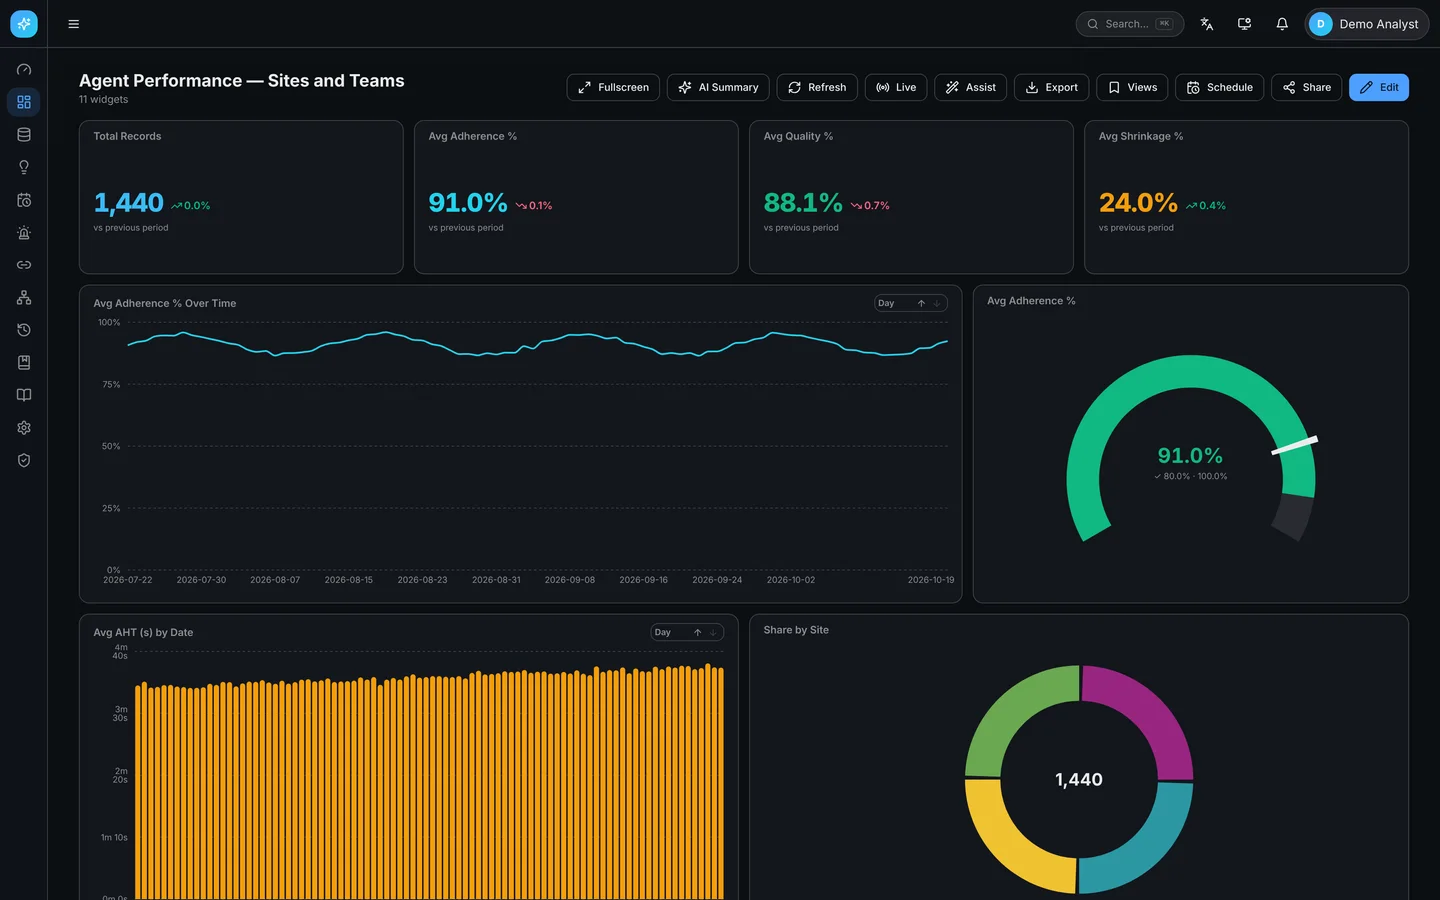
A second dataset, a second board — adherence, quality and handle time per site and team, designed in the same one click
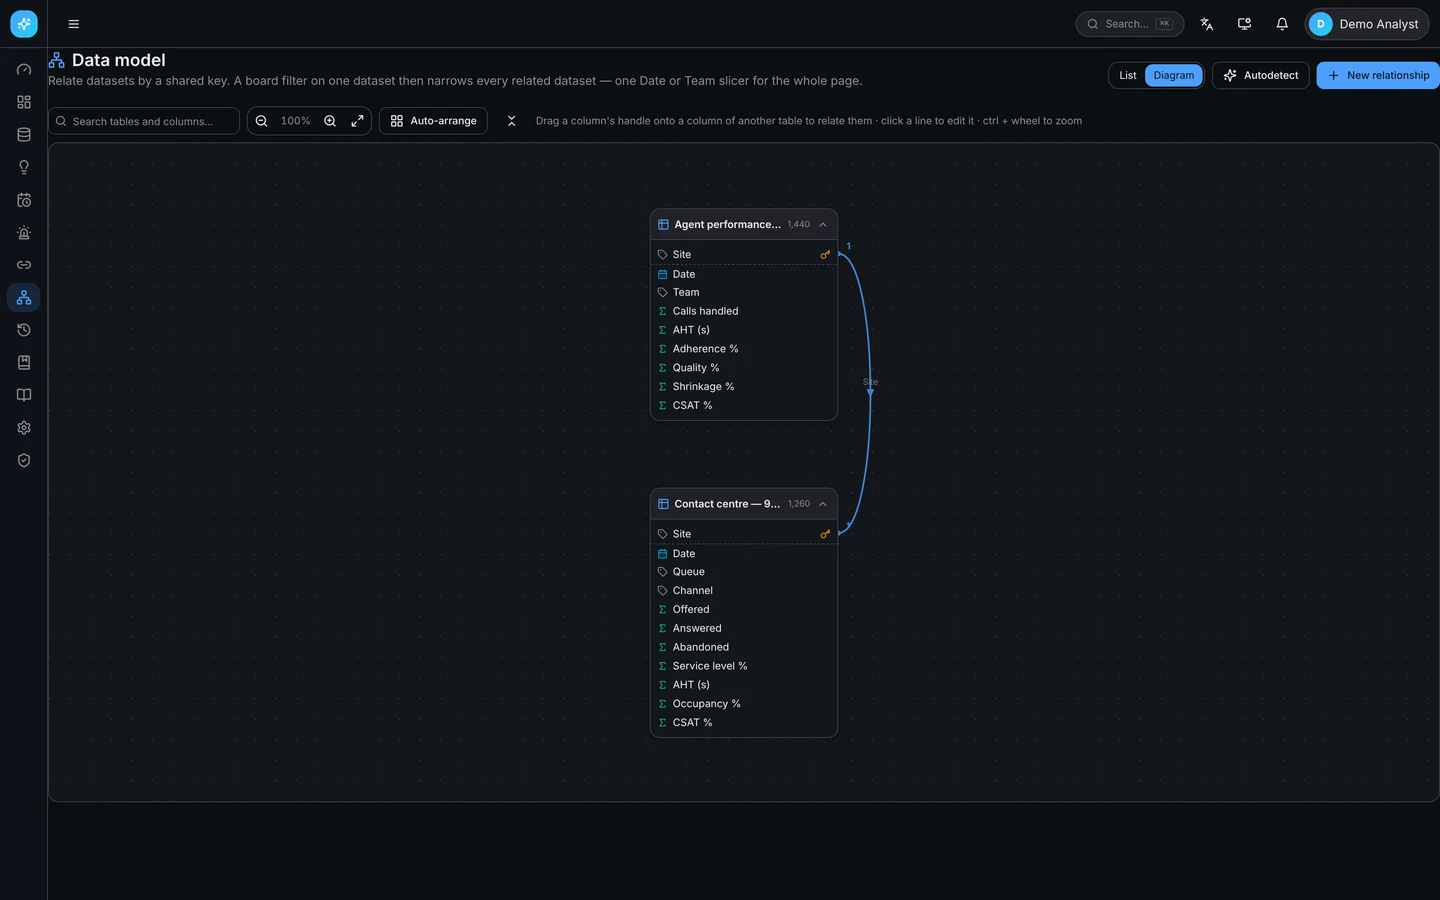
The data model: two tables related on a shared key, so one filter narrows both
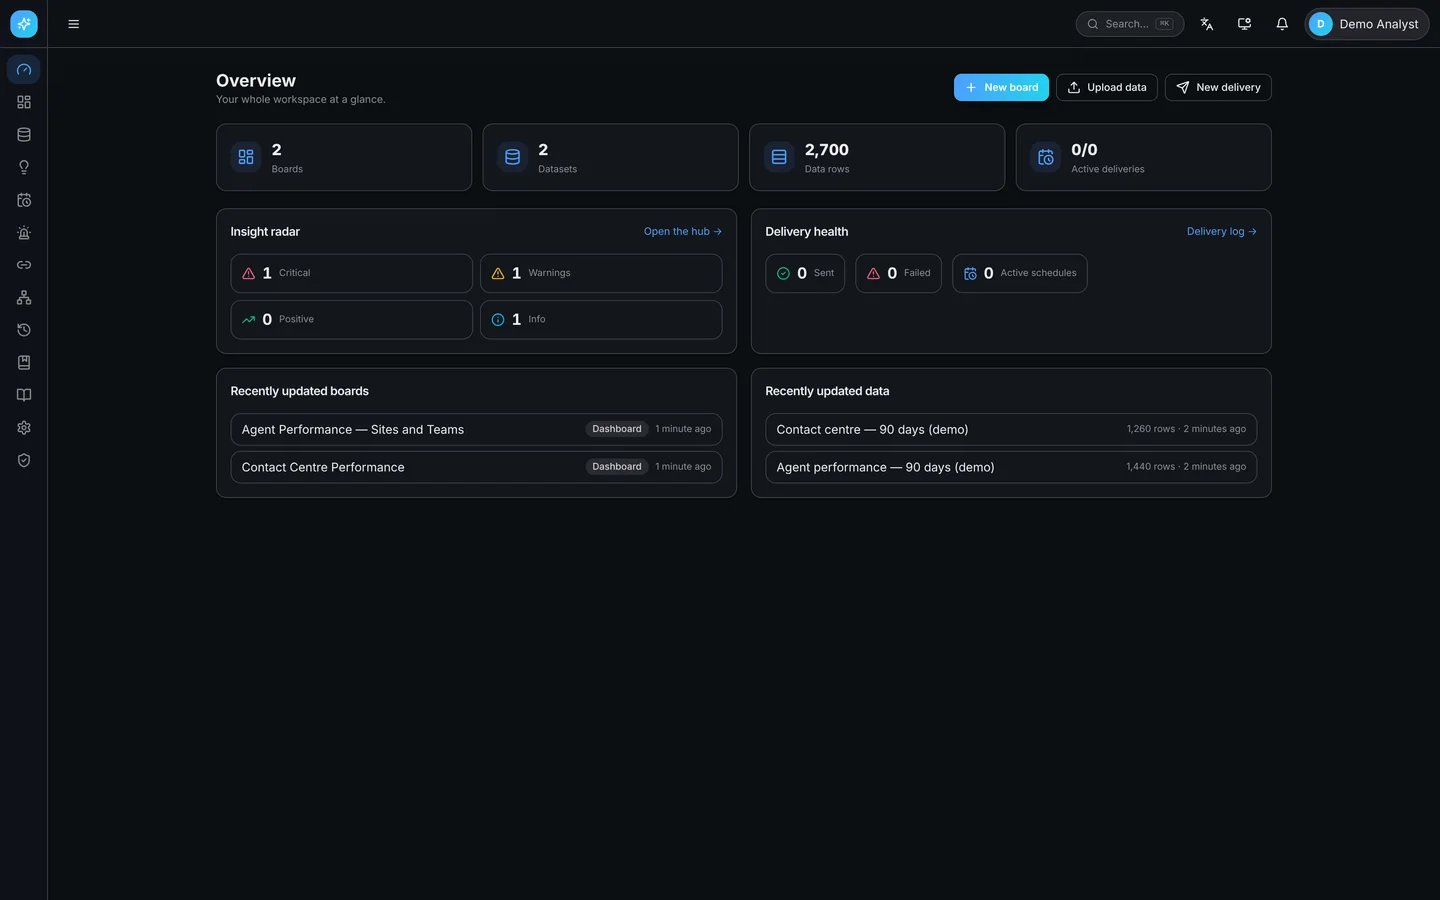
The workspace at a glance: boards, datasets, rows, the insight radar and delivery health
Every automatic finding in one place, filtered by severity

Captured: 18 October 2026